5 reasons to use AngularJS in the corporate app world

large-companyAngular

The current situation in the world of corporate apps can be described with one word, chaotic.

Between legacy code that has been around for N years jumping from developer to developer with no documentation. To over complicated interfaces that are over complicating the code. To a mixture of N technologies in one single app. Lets face it, these things were not built with maintainability and support in mind. The problem we face today is, how do we fix all these apps? Where do we start? How do we bring sanity into them? How do we bring them into state of the art tech stacks?

This post represents my opinion of why using AngularJS in corporate applications will not only bring sanity to your apps, but it will allow them to evolve into the future.

1) Start little by little

In an Enterprise you are probably starting with an ugly brownfield project, not a nice green field. Something that has been cooked and baked many times over. Making sense out of it is so hard that developers normally tend to just throw away and rewrite. This of course affects cost and time.

With AngularJS this is not the case. You can start by sprinkling it in some places of your app that you can slowly start to rewrite. Believe me I’ve done this before and it actually WORKS. Not only does it work but it allows you to put the seed of a soon to become amazing application. Given the fact that you can put your ng-app anywhere, you can say for instance – Hey, why don’t we start updating this app with the home screen. Then you get your back end guy to write the web services (yes I am a front end developer),  you start writing your tests with Karma Test Runner (thank you Voijta Jina) and in no time you suddenly have a Controller a View and Model for the home section of your app, which kicks in when a the given home route is reached. All of this controlled by AngularJS and living nicely encapsulated in its own little world. My friend you have just done a very very good deed.

2) Fast developer adoption, at just a click away

Technology changes so fast that keeping up to speed has become quite a hard task. You either have the right ways of learning or you suffer buying all kinds of O’reilly books and trying to figure out how this thing works.

One of the cool things that have popped not so recently into the scene are Javascript MVC frameworks. These came to be because the community realized how much Javascript was becoming hell to maintain and make sense out of. Javascript MVC frameworks are a good thing and need to be learned and applied when necessary, such as in our case of web applications.

With AngularJS if you know absolutely nothing about JavaScript MVC frameworks you can basically just hop into the AngularJS site, take the tutorial (which is quite cool by the way) and in 10 lessons or so (About 15-30 mins) you will know exactly how to start breaking out and building up an application using a Model a View and a Controller (MVC) and the best part, having all of it be testable.

This allows for large teams to go online at any point in time, take the tutorial and, because they are learning from the same source, they can ask and feed from each other at their own pace. This is very important specially if you have a team that is working remotely from each other.

3) Productivity and Scalability.

Having the ability to scaffold a project quickly with all the goodies that you need is key to getting started and producing efficiently. I’ve been in projects that take about 1 week just for everyone to jump on and install everything that is needed for the given project. This slows down productivity and it is a clear sign that something is still missing from the recipe.

In order to fix this we can use Yeoman. Yeoman is a workflow comprised of a collection of tools that allow you to quickly start, run and build a project.

Yeoman glues pretty well with AngularJS (makes sense since they are both part of the same family). Yeoman will allow you (via generators) to create an AngularJS repo that includes all the latest Twitter Bootstrap stuff, angular goodies, Karma Test Runner etc. And glue it all together just by initializing it under a directory with any name (preferably something related to your app). It will use that name to namespace the application and with that, it will create a sample view tied to a sample controller, tied to a sample test (thank you Brian Ford).

This structure not only allows you to quickly assemble something up, but it lays the roots for something way bigger to evolve. On top of that, once you are ready to deliver, you just run a grunt command and your files get compressed and combined (use ngmin) and put into a separate distribution folder. How sweet is that!

Aside from everything because you are building a single page application, everything should be RESTFUL which means that this app can and will interact with ANY back end code as long as it gives the front end the JSON it needs. You are decoupling your code and logic making it easier to scale and evolve.

4) Tests tests tests

Situation: There are thousands maybe hundreds of thousands of lines of code in a project. You are dropped smack in the middle of it. There is no documentation and there is a new feature that needs to get implemented ASAP. You start fiddling around with the code, next thing you know something else where breaks and you have no clue why… now you have to spend hours maybe days navigating through spaghetti code to see how your change broke something else.. bad, very very bad.

One of the most important things for maintaining a large code base throughout time is the usage of tests. By using Karma Test Runner given to you by the AngularJS generators in Yeoman, you can have your unit tests running all the time in the background, that way if you change anything and hit save, your tests will automatically re-run and you will know if you are breaking something, where you are breaking it, and if the tests are built correctly maybe even why you are breaking it.

This is super useful because normally this is how developers test insert a new piece of code. They add in 10-15 lines, they save then whoops, something breaks. Then they comment out 8 lines of code or so. Save, rerun still breaks? No? Ok so the error must be in these 2-5 lines.

Way way simpler to do this than to have to navigate through N files of hidden dependencies and figuring out what the previous developer was thinking when they were building this out.

5) Good community support

So many times you find yourself stuck with a piece of code and have absolutely no idea why it is not working. The community has never failed me so far when it comes to helping me out with a problem. I ask a question in Stackoverflow or a Google group and within a few hours or maybe even minutes, I get the answer I was needing, sometimes even from the core AngularJS team its self! This not only helps you out but by solving your issue, others might solve their issues as well. This speeds up the learning curves and the detection of any glitches that the tool might have. It basically feeds on its self and continues to evolve and grow.

Conclusion: The usage of a very opinionated Javascript MVC framework such as AngularJS is an excellent way to start cleaning up legacy code for it allows you to start in small pieces and bring sanity piece by piece. If your tech team is not on the bleeding edge they can take the AngularJS tutorial online at their own pace and learn how to use it. Once they are done and ready to produce they can incorporate Yeoman and kick start this upgrade within a few minutes, using AngularJS, Twitter Bootstrap, Karma Test runner and many other goodies that Yeoman scaffolds out. As the developer starts building they can use Test Driven Development to create unit tests and scenario tests for everything they build out in AngularJS. This will guarantee that in the future if anyone new jumps on the project and needs to make modifications, they will be able to do so more easily and with more awareness of what their lines of code are affecting.

AngularJS is not the final bullet proof solution, but it is helping pave the way for cooler things that are coming in newer versions of Javascript such as object.Observe, better controlled scopes etc. These will in theory (and I do believe so my self) bring order in a more natural way into all applications using Javascript.

CSS Challenge

A good friend of mine, Laurent Brucher was tasked to interview a candidate with regards to his front end skills. We talked for a while, shared ideas and in the end he came up with a clever challenge for the candidate to code out.

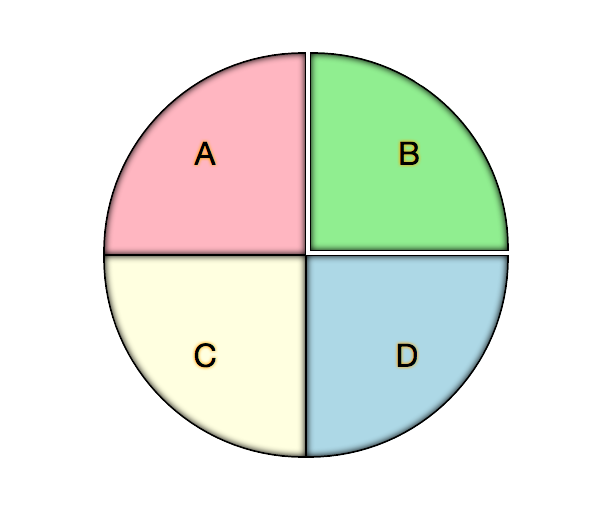
Inspired in his challenge I’ve crated this one below

Sliced circle

Create a JS fiddle with your solution. Use only HTML and CSS
Whom ever uses less classes and less attributes will be declared the winner.

Create any map of the world in SVG

There is nothing cooler than having a map fully powered by data. D3.js does a great job at this by accepting geoJSON data and converting that into SVG. The thing is how the hell do we acquire a map that is not the one of the USA (which is the most typical example). There are many tools out there that do svg maps and they are quite good at it, but this tutorial is going to focus on D3.js, .shp files and geoJSON.

Two of my favorite resources to obtain maps are Natural Earth Data and Diva. From what I’ve seen Natural Earth Data does a good job for country layouts (just the outer border) and Diva for details within a country (regions, lakes, rivers, train tracks etc). For this example we are going to use Natural Earth Data because it already provides us with a map of the world.

Step One

  • Go to Natural Earth Data
  • Select Downloads
  • We want a good detailed map so select from Large scale data, 1:10m the cultural option
  • Focus on Admin 0-Countries from the list and click Download Countries (this will give you a full map of the world with all of the countries in it)

Step Two

Install QGIS

If you are using a mac make sure to install all of the dependencies first ( GDAL Complete and GSL )

Step Three

Manipulate map with QGIS

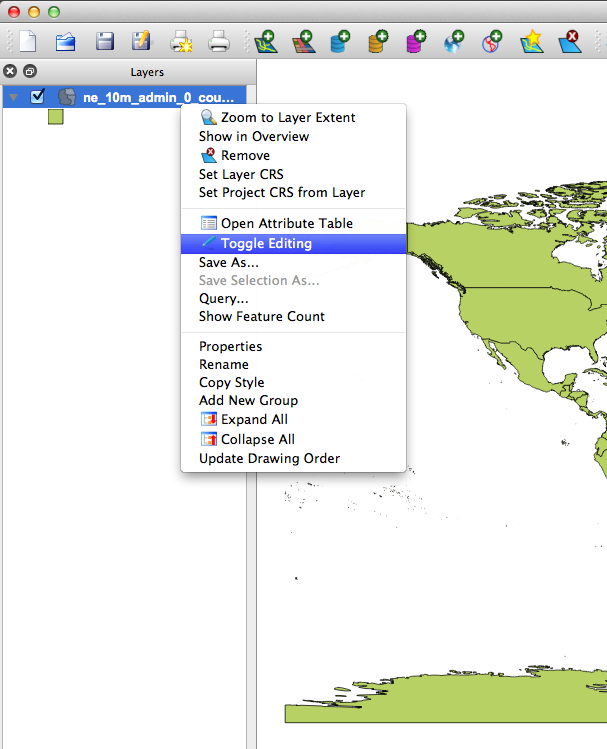
Extract the zip file downloaded from Natural Earth Data. Open the .shp file with QGIS. You should see a map of the world like so

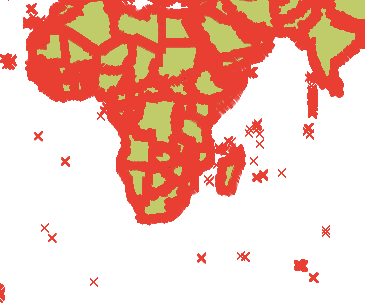
After opening on the left hand side make sure that you have enabled the layers panel, right click on the layer you are viewing and select Toggle Editing. You should see something like this:

If you are unable to see the layers panel bar you can show it by clicking on View > Panels >Layers. That should enable the panel.

Now with our map ready to be edited go to the move feature  located in the tool bar, select it by clicking it and then point at the country you want to use. For this example we are going to focus on Madagascar

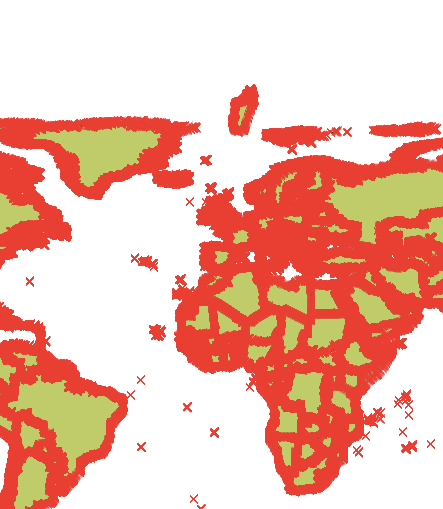
Click on Madagascar and move it away from the rest of the world. Say some where up North near Greenland or something. This is just to create enough space in order to remove the rest of the world’s vectors from our map.

Once moved you should end up with something like this:

Next we will remove the rest of the world by selecting the “Select Features by Rectangle” option . If you have a small screen like I do right now it might be hidden behind the “Identify Features” icon . Select the chevron and that will show you the “Select Features by Rectangle” option.

With the “Select Features by Rectangle” option selected we proceed to select the rest of the world by clicking, dragging and surrounding the world EXCLUDING MADAGASCAR.

Your world aside from Madagascar should have turned into some kind of highlighted color (varies every time). Click the Delete option  and remove all of the vertices that are selected.

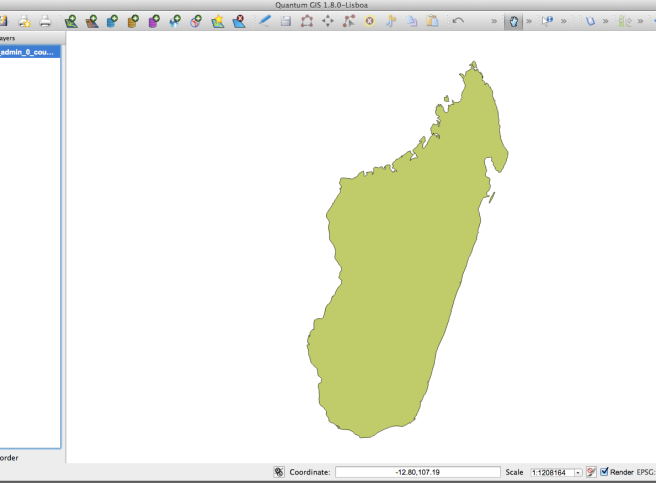
Use the “Pan Map” option  to center Madagascar right in the middle. Next zoom in by scrolling up/down in order to see better our final Madagascar.shp file.

You should end up with something like so

This map is now free from all the crap that it doesn’t need. Still it might be a little bit to heavy if say for instance you want all of Australia. For scenarios where we are using to many vertices there is a tool called <a href=”http://mapshaper.com/test/MapShaper.swf”>Map Shaper</a> that allows you to upload a .shp file and minimize the number of vertices that it contains as well as export back into .shp format. This will come in handy so keep it in mind! =)

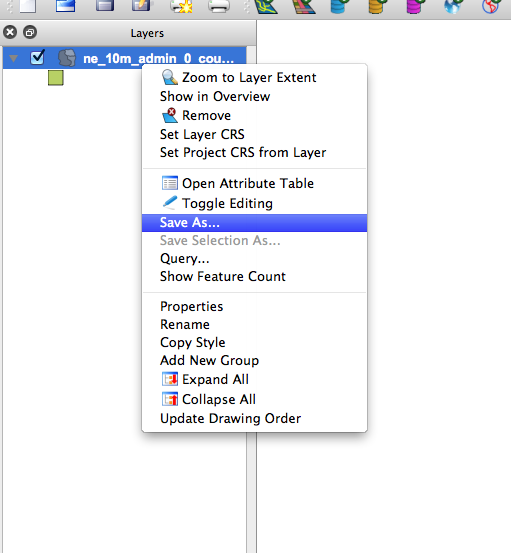
Next we proceed to save our .shp file into geoJSON format and we do so by right clicking on the Layers panel the only layer we have and choosing save as

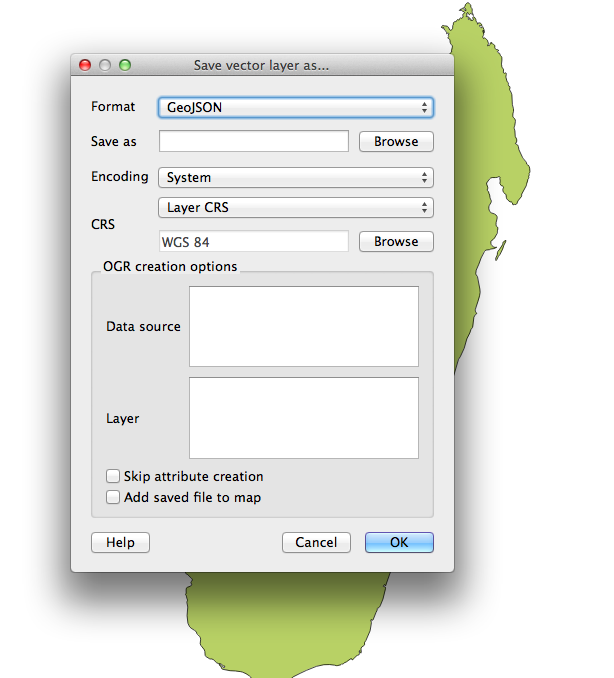
This will pop up a window. Choose GeoJson from the Format drop down like so

And voila! we now have Madagascar in geoJSON format.

Next we will use the power of d3.js to convert our geoJSON data into an SVG map.

Step Four

If you don’t have d3.js head over to its site and download the minified or full versions. We are going to need also jquery in order to do some DOM manipulation; so add that into the equation as well.

Lately I’ve been doing a lot of coffee script and thanks to my good friends Alex and Thomas I am now an auto proclaimed coffee script evangelist, which is why our d3 code will be written in coffee script. Both Alex and Thomas have some really good posts on maps and d3. Make sure to check out this post from Thomas Positioning and Scaling maps in d3 and this one from Alex Interactive Maps with d3 and ember. You will find a lot of valuable cool stuff in them!

We will need a base index.html file to gather everything together so create one like so

<!doctype html>
<head>
	<meta charset="utf-8">
</head>
<body>
	<div id="vis"></div>
	<script src="jquery.js"></script>
	<script src="d3.js"></script>
	<script src="script.js"></script>
</body>
</html>

We now proceed to fill out script.js with our Coffee script code as follows:

xy = d3.geo.mercator().scale(8500).translate([0,-1200])
path = d3.geo.path().projection(xy)

vis = d3.select("#vis").append("svg:svg").attr("width", 960).attr("height", 600)

d3.json "madagascar.json", (json) ->
 vis.append("svg:g").attr("class", "tracts")
 .selectAll("path").data(json.features)
 .enter().append("svg:path").attr("d", path)
 .attr("fill-opacity", 0.5)
 .attr("fill", "#85C3C0")
 .attr("stroke", "#222")

or the javascript version if you prefer

var path, vis, xy;

xy = d3.geo.mercator().scale(8500).translate([0, -1200]);

path = d3.geo.path().projection(xy);

vis = d3.select("#vis").append("svg:svg").attr("width", 960).attr("height", 600);

d3.json("madagascar.json", function(json) {
  return vis.append("svg:g").attr("class", "tracts").selectAll("path").data(json.features).enter().append("svg:path").attr("d", path).attr("fill-opacity", 0.5).attr("fill", "#85C3C0").attr("stroke", "#222");
});

There are a few interesting parts in this code. Notice the projection (mercator) the scale(8500) and the translate([0,-1200]). To be 100% honest I’m not totally sure of what these values do exactly but I know that tweaking the scale and the translation accordingly will enlarge (scale) and center (translate) your svg object within its dimensions (960 width and 600 height). The projection mercator is in reference to the entire world, so Madagascar is located not so far from the center. You will most likely end up doing trial and error until you get the right scale of the country you want. I recommend starting with a small scale, say 200 and a translation of [0,0] so that you start from the top left corner and they progress your way.For more details on this please refer to d3.js

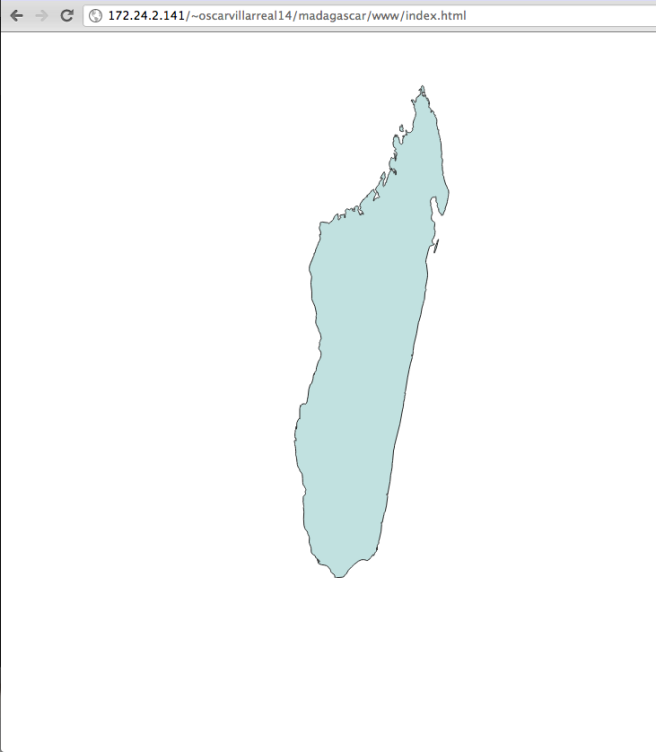
After compiling this coffee script code into JavaScript code you should end up with something like this

That’s all for this post and if you have any cool idea of how the projection, translation and scaling exactly works or if there is an algorithm to it, so that we can know what values to put in there instantly please drop a comment and let me know and I will gladly add it in your name!

Good luck with your hacks!

Some useful links

Big Thinking – strange maps

Forget console.log

I remember the day I learned that I could use console.log to test my app instead of having to alert everything. Man did I feel good and smart. Everything was very smooth, and fast. No longer did I have to close every single alert in order to get to the next one, nor did I had to worry about leaving some rouge alert saying You made it into the if!

But then again every time I tried to test in IE beauty became the beast. Instead of getting a good log in the IE console which… ooops doesnt exist, I got a nasty js error saing what the hell is console.log ?

So I got into the habit of cleaning up my console.logs after using them which really didn’t help me testing out something in staging or dev because when you are making heavy client side apps, everything is ajax based, and you always need to know if you are showing the exact data that you received or if your js code is doing something funky.

Solution simply use another function that checks if console.log exists and if so log it, else don’t


function cLog( text ){
if( (window['console'] !== undefined) ){
console.log( text );
}
}

Updated with a better solution

if(!this.console){
window.console={
log:function(){}
};
}

— Update as of sep 28 2014,

Using a grunt task to remove all your logs helps prevent deployment of logs, and avoid IE9 errors.

https://www.npmjs.org/package/grunt-remove-logging

Enjoy!

Good js maps

Recently in my latest project I was asked to build a world map where a user could select different countries for which we have certain data of and visualize that data. I tried every single mapping/charting tool I could find. This is a compendium that compares each one of the tools I went through and hopefully it will help you out in deciding which one to choose.

Google Geo Map

Geo Chart from Google

The first think I learned with Google Geo Map is that not because it has the label Google on it means that it is bound to be kick ass. I mean sure, a lot of their tools are kick ass and they do a great job with documentation and examples. But in this particular senario Google Geo Map just didn’t cut it. For instance if you have data loaded for Sout Africa and Lesotho as well, hovering over South Africa will dissapear Lesotho from the map…. yep bugs. Kosovo is no where to be found and well if you want the map to work in IE7 simply forget it. All of the tooltip labes that show uppon hovering will come out blurry and there is just no way to fix it. The work around is done by browser sniffing and implementing a flash solution for IE7. Now as crazy as this may sound given the fact that the map creation is 99% similar you can create either an SVG object or  FLASH object quite easily with the same code base… still this gets messy even if you try not to because the country codes for the flash map are different from those of the svg map. Hence you need to have two sets of json files….

Openlayers

Openlayers world map

Given the fact that I had to make the app work with IE7 and that Google was simply not going to provide me with an easy implementation that would suffice my needs, I turned around to openlayers.

Open layers is an amazing library that is extremely well documented. If you have the time to go through its entire documentation I strongly recommend you do and as that prepare your self in case you ever have to build a tool with a world map. Now at first glance I though I had found the tool I was so eagerly looking for but again I was deceived. Time was against me and I had basically two days to get this thing working and I was back to cero. Getting a simple map to work took for ever and finding the key points in the documentation that would allow me to fulfill the user experience that I wanted to create was turning out quite impossible.  A simple action like clicking on a country and getting its position or country code needed a combination of iso cods and geographies and on top of it there were some bugs that I just wasn’t able to pin point and fix like limiting the zoom level even though it clearly states in the documentation how to do it.

jVector map

jVector Map

In comes the hero.

Finally a map that is extremely easy to implement, has all the key functionalities that you would expect a world map to have (like clicking on a country or hovering over a country), highly customizable and friendly and works all the way down to IE7 like a charm. The only downside would be that it doesn’t have by default a lot of individual region maps. For instance if you want to show only the map of Africa, there is no individual SVG map for it. This is still a very particular use case because the map does have zoom in and zoom out functions in order to pan into the map and drag around to move from one part of the map to the other.

Hope this helps in deciding what tool to use!

vmware and localhost

Recently I’ve included into my suite of software VMWare Fusion. I was previously using the open source Virtual Box and a copy of Windows XP to emulate IE7 inside of my mac. I’m a web developer so IE counts wether I like it or not.

Even though I had these tools I realized to hitting into localhost was not as easy as just typing localhost:9000 or what ever port into my emulated IE. So I did a bit of research and found this post from Rowlandos Blog which I am simply going to paste here as a reference

Type ifconfig vmnet1 into a Terminal window. You should get a return like this:

vmnet1: flags=8863<UP,BROADCAST,SMART,RUNNING,SIMPLEX,MULTICAST> 
mtu 1500 inet 192.168.115.1 netmask 0xffffff00 broadcast 
192.168.115.255 ether 00:50:56:c0:00:01 

The “inet” number is your “secret” IP (in my case, 192.168.115.1).

Now that we have that number, we can edit the hosts file on the VM. We find it in: C:/WINDOWS/system32/drivers/etc. Just open the host file with Notepad, and add each virtual host (domain) on it’s own line at the end of the document, like so:

192.168.115.1 dev.triumphofgrace.com 

… and save. Afterwards refresh the VM’s DNS cache by typing ipconfig /flushdns in a command line window.

Boom, you can now point to your macs localhost from your emulator and test all that you need to test in Windows.

Best of luck!

How to start off the UI of your project

Back in the day one would have to create a series of fixed clases that would help you out through out the construction of your site. Classes that you now if chained with other clases would allow you to create very interesting and cool looking layouts. Today the answer is quite simple use html 5  boilerplate. The boiler plate comes packed with a bunch of useful css resets, browser sniffs for versions of IE, and if iE6 a built in chrome frame tag that allows the end user to install chrome frame into their browser if they desire to have a better experience.

The boilerplate is regularly maintained by Paul Irish ( a very bad ass developer ) and others, and it will definitely give you a fast start to build a web app with all of the standard folder structures you would expect a high quality web app to have.

One thing though, the boiler plate does not come with a CSS grid framework. For many developers that are becoming or have to become Front End develoepers for their projects this is quite an issue. Many developers rely on the use of some kind of css grid to give them a logical structure they can follow in order to build their websites. If you are using html5 boilerplate I recommend you get  super light grid framework such as 1140 grid or something a bit more complete like blueprint.

If you are like me and don’t like using grid frameworks because you like to build your own grid when you code then the boilerplate by it self will be very useful.

Keep in mind that there are many things included in the boilerplate and that you should with out a doubt go over all of the css code that is provided and make sure that everything that is in there is needed by you or your project.

Last but not least use CSS SPRITES!!! Its amazing that in todays world many people still seize to use css sprites. Ok maybe if you are thinking that your images need to scale in order to fit in multiple screen resolutions your not going to be using sprites for them. But normally there are tons of icons used in a web app and those icons by default should be implementing using sprites.

The technology for sprites is quite simple. Create one big image using Photoshop, or Fireworks or your image editor of preference. I use those two because I’ve been working with them for a while but if you want an open source solution the Gimp is definitely an awesome editor. In this big image you are going to stick in all of your little icons, preferably organized in a nice grid structure way. Make sure to leave some gutter between the icons just so that they are easier to identify and extrapolate in the future with css.

Once this image is done save it in the web format you prefer. Thinking of performance go for gif 256 or if you want better quality Photoshop has a built in “Save for Web and Devices” option that allows you to save as PNG and at the same time compresses quite well.

Ok so now you have a big image that has all of your little images inside of it. Now what?

Using css you create a parent class that will contain that image. If you want a nice name that makes good reference use the class

.sprite{background-image:url(/images/pathToYourSprite.gif)}

This will allow you to have all of the icons within one class. Next create the individual icon classes that you will be using. For instance if I were to have a light bulb icon in my sprite use the class

.lightbulbIcon{background-position:0 0; width:16px; height:16px}.

The background position marks the top-left starting point of the icon you want to pinpoint. Next the width and height are the width and height of the icon you are using.
In order to use include both classes within a html tag such as follows

<div class="sprite lightbulbIcon"></div>

This will render your lightbulb icon inside of the div tag. If you want more flexibility for icons in different tags include an inline-block attribute in your style like so

.sprite{background-image:url(/images/pathToYourSprite.gif);display:inline-block}

That will let you use anchor tags, spans etc.

Hope this helps!